
Corporate venture investment in startups is now a mainstream activity. Some 72% of companies in the S&P500 have had some involvement in corporate venturing, and GCV has tracked around 7,500 corporate venture investors globally over the past decade.
But whether this investment in startups has an impact on corporate performance has always been a difficult question to answer.
Analysis by Global Corporate Venturing of companies in the S&P500 Index indicates that companies with corporate venturing units — especially if those units have a high level of activity — performed better on a number of measures than those with no CVC activity.
FINDINGS:
- 72% of S&P500 companies have had some kind of corporate venturing activity
- The stock price and revenue growth of companies with CVC activity is marginally higher than companies without
- The performance differences becomes more pronounced with companies are divided into those with high levels of CVC activity vs lower or no levels, with active companies performing noticeably better on revenue, share price and free cash flow growth
- There is a more mixed picture on EBITDA growth
- On free cash flow companies with low CVC activity perform worse than those with no CVC at all
One interesting note is that there is a bigger difference between the performance of companies with active and less active CVC units, than there is between companies with low CVC activity and none at all. In terms of free cash flow, companies with low CVC activity perform worse than those with no corporate venturing activity.
It is important to note, however, that correlation is not causation. It is not possible to determine whether companies perform better because of the CVC unit, or whether better-run companies, with better performance, are more likely to have active corporate venturing units.
We’d therefore like to present the findings to the corporate venturing community as a starting point for further exploration. We would like to hear comment from practitioners on whether there is any evidence for establishing causation around this data.
The analysis
Corporate venturing can involve anything from running an internal incubator programme for employees with good ideas to taking LP stakes in traditional VC funds. But the most organised efforts involve having a team of corporate venturing professionals investing from a dedicated fund, much as a venture capital firm would.
We have taken a relatively broad view of corporate venturing, taking that to mean any investment in a minority startup stake by a corporation. One of the interesting findings in our study of S&P500 companies was that most of them — 72% — have now engaged in some form of corporate venturing.
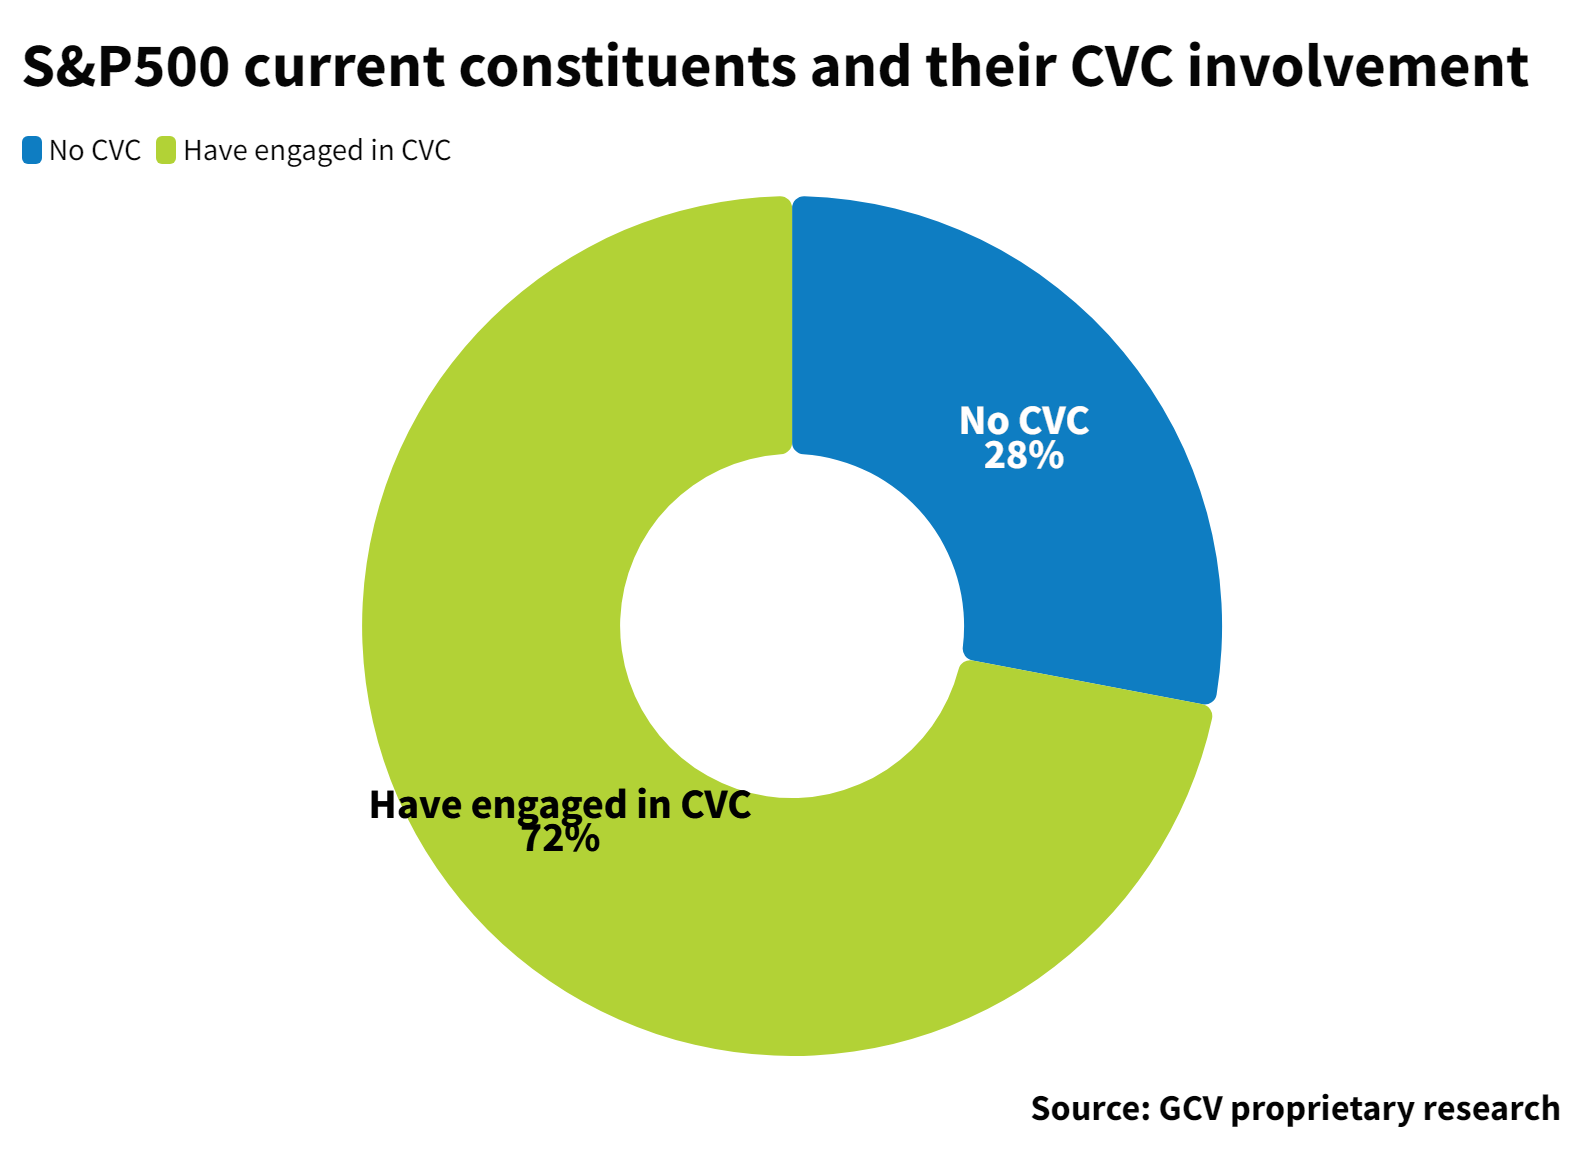
With the broad definition of corporate venturing there are vast differences. Some of the most established corporate venturing operations, such as Chevron Technology Ventures or Johnson & Johnson’s JJVC unit, can have teams of more than 40 people and investments in more than 100 startups.
The biggest corporate venture funds have more than $1bn in capital. Companies with such “mega funds” include Alphabet, Amazon, Salesforce, Pfizer and Hearst, although most CVC funds globally (59%) tend to be around $100m or less.

Even a $1bn fund can feel small in the context of a multinational corporation with revenues many times this level. There are some cases where large investment programmes have proven transformational for companies.
China-based technology conglomerate Tencent has holdings in more than 600 companies. It is not only one of the world’s most valuable companies but also considered to be one of the most innovative. Some of its holdings, such as its stake in ecommerce company JD.com are worth tens of billions of dollars — Tencent handed a majority of its stake in JD, worth some $16.4bn, to its shareholders as a dividend payment in 2021.
Prosus, the technology investment group that came out of South African internet group Naspers, says its food and edtech businesses were born out of investments made by its Prosus Ventures investment arm.
But Prosus and Tencent are not part of the S&P500 and often it can be difficult to trace any direct impact on the fortunes of the parent company in US context.
Corporate investors often steer away from talking about traceable financial impacts because they are so hard to demonstrate. They will tend to emphasise that strategic impact can come in the form of learnings, insight into emerging new market segments, the ability to source new technologies rapidly or even an option to buy a potential competitor before being overtaken. These effects are notoriously difficult to measure for any individual company.
But we wondered if it would be possible to see any differences in performance between a basket of companies that had CVC activities and those that did not. We looked at the performance of companies in the S&P500 list between 2013 and 2022 observing a number of factors, including revenue, EBITDA, free cash flow and share price performance.
When splitting the companies just into those which had engaged in CVC and those which had not, we already found some marginal differences between the two groups: corporations engaging with CVC marginally outperformed the rest, registering a CAGR price return of 7.71% versus 7.21%. This is a relatively modest outperformance, but when compounded over a long period of time, it could generate a substantially higher final return.
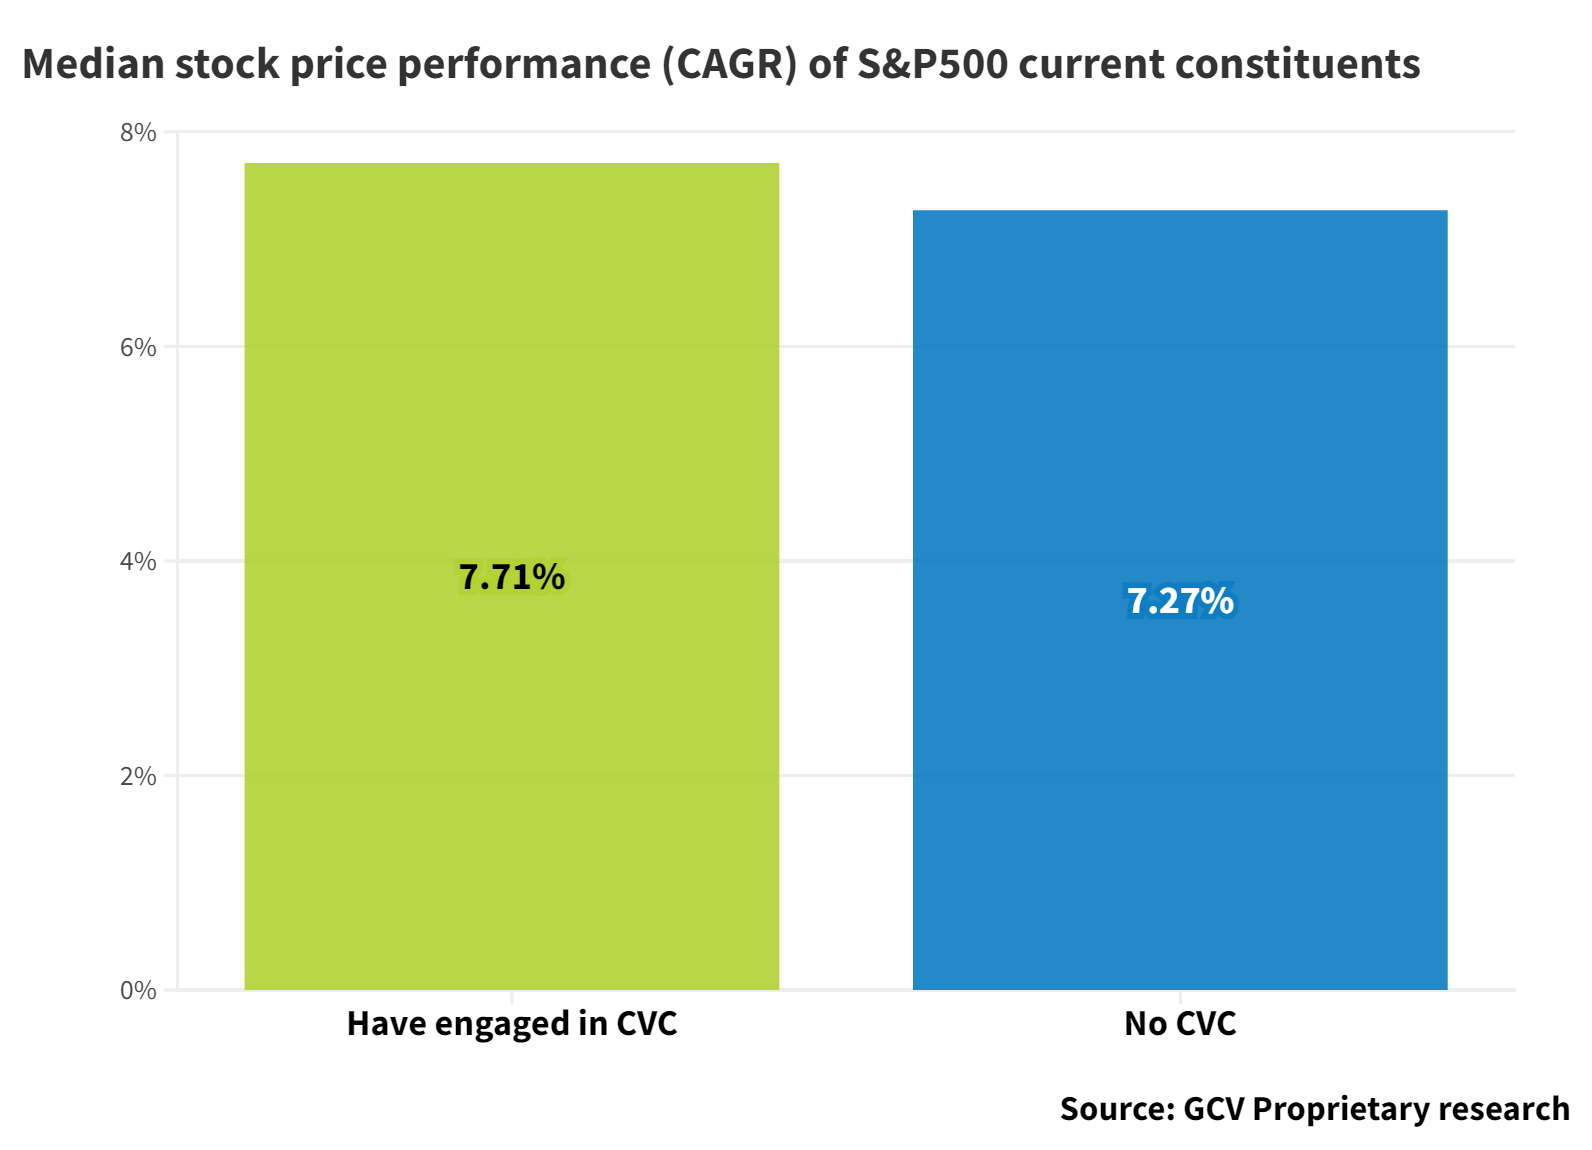
Stock price performance is, of course, mostly outside of a corporation´s control. Nevertheless, the results are in line with a 2017 study by Touchdown Ventures, which found that the median US corporation with an active venture capital unit grew its share price approximately 30% faster than its respective market index, over a period of about a decade.
We expanded on the Touchdown Ventures study by looking at a a number of other indicators, including revenue growth. There, again, we found that corporates that undertook CVC activity marginally outperformed, with a median CAGR of 6.62% versus 6.28%.
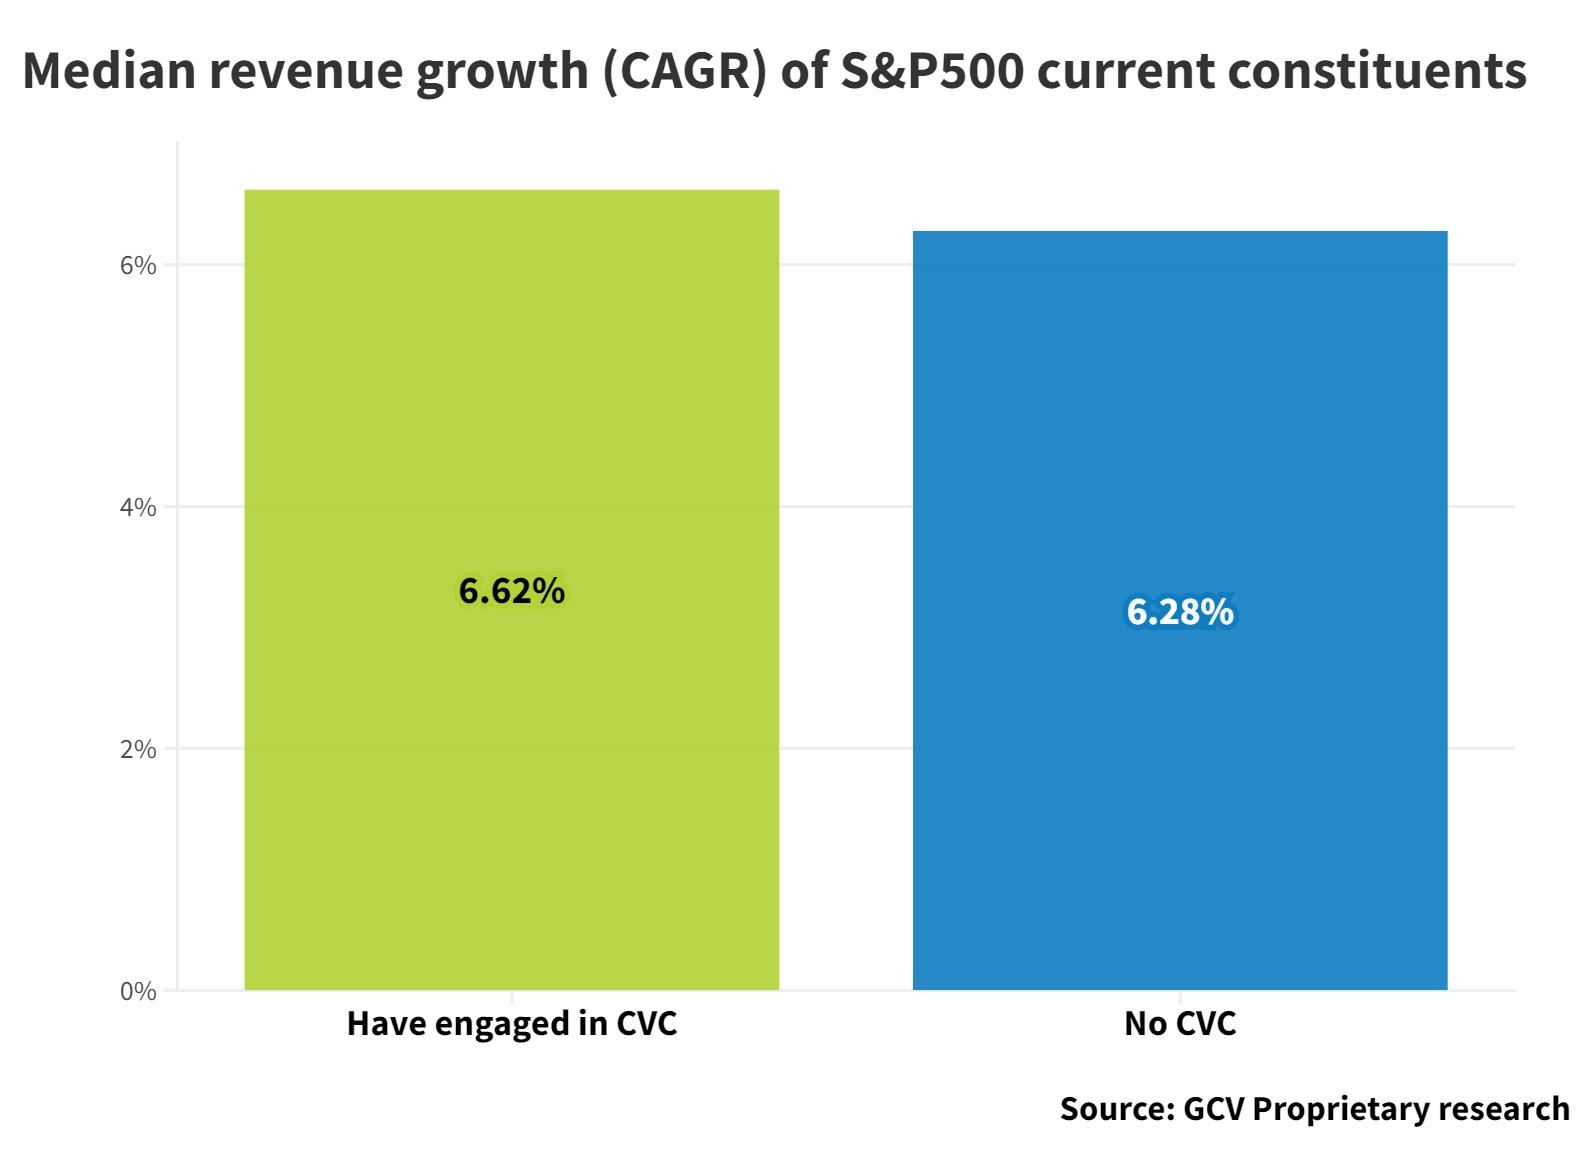
Sales and stock price performance may be linked. The aggregated price-to-sales ratio of the S&P500 has been on an upward trajectory, having risen from about 1.0x around the time of the 2008 financial crisis to 2.7x as of February 2024. The stock market has increasingly valued higher sales performance over time.
Performance differences grow when CVC activity level considered
These slight difference in performance indicators become much more pronounced when we divide the corporates further into three groups:
- Most active (those having done 25 or more transactions since 2016)
- Rest of CVCs (those with 24 or fewer transactions tracked since 2016)
- No CVC (those with no CVC deals on record)
If we account for the level of dealmaking activity, the cohort of the ‘most active’ outperforms significantly, with median stock price appreciation of 8.49% vs 7.51% for the ‘Rest of CVCs’ and 7.27% of the non-involved.
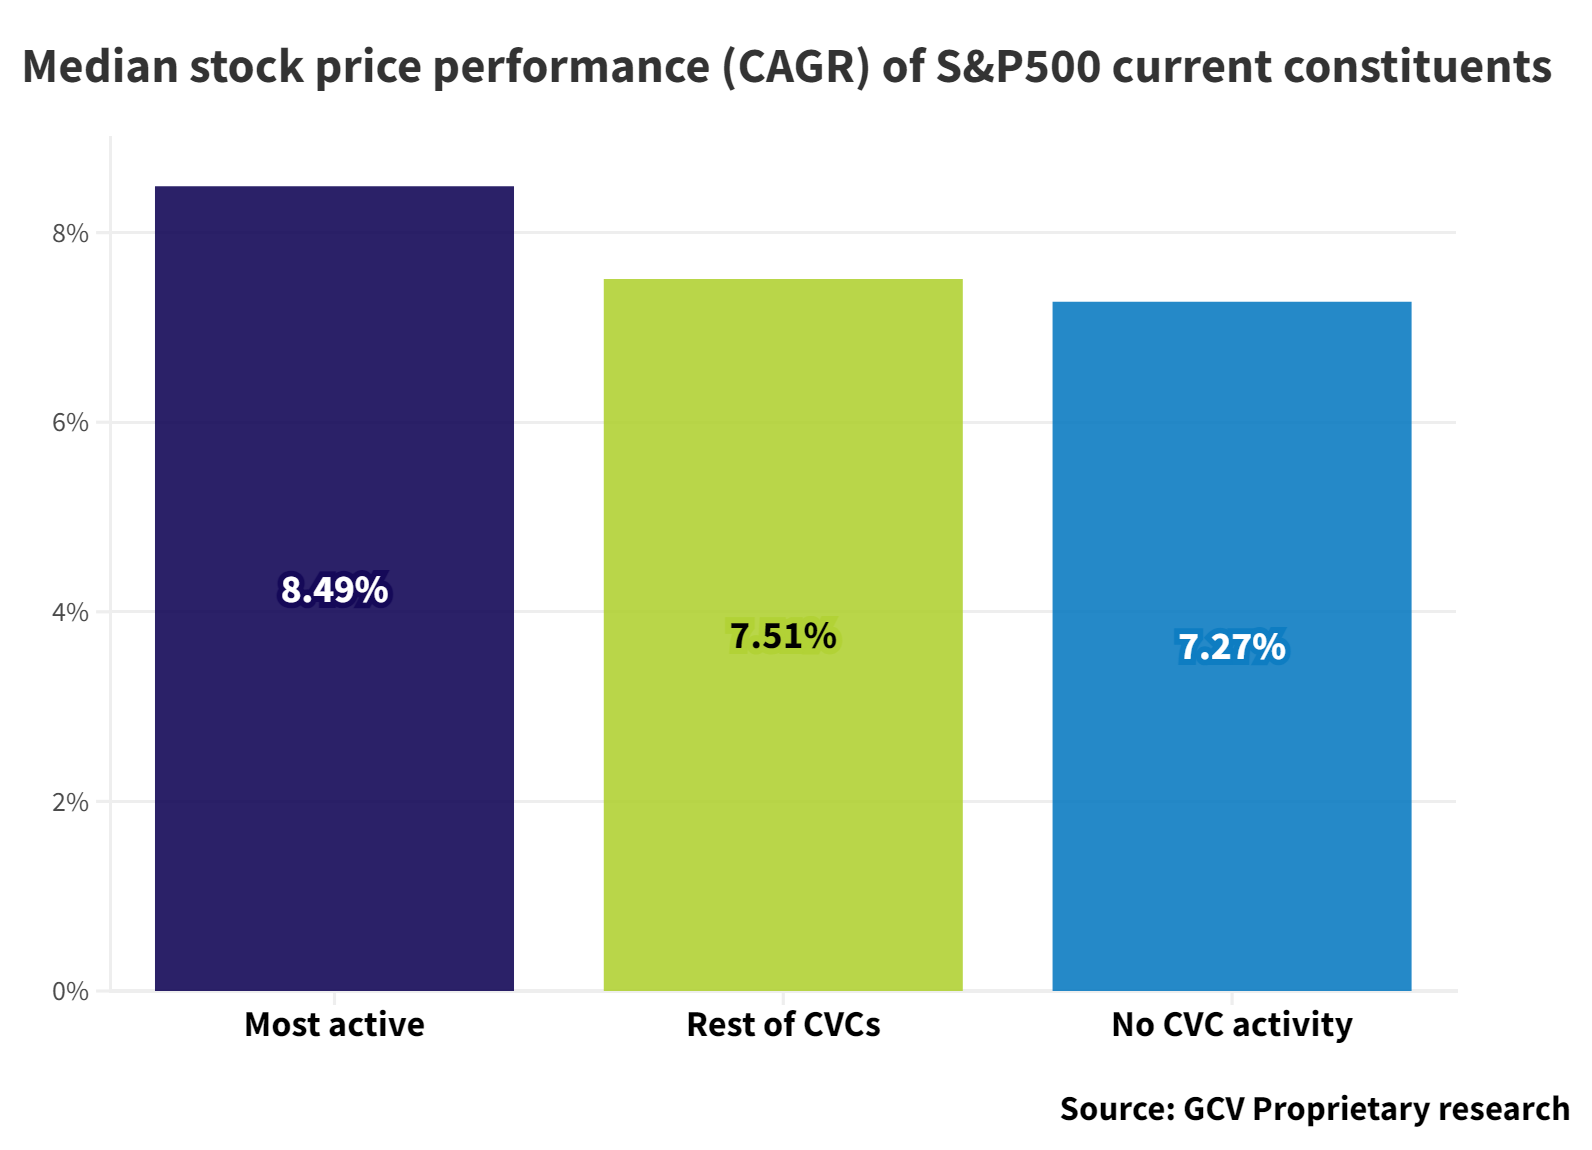
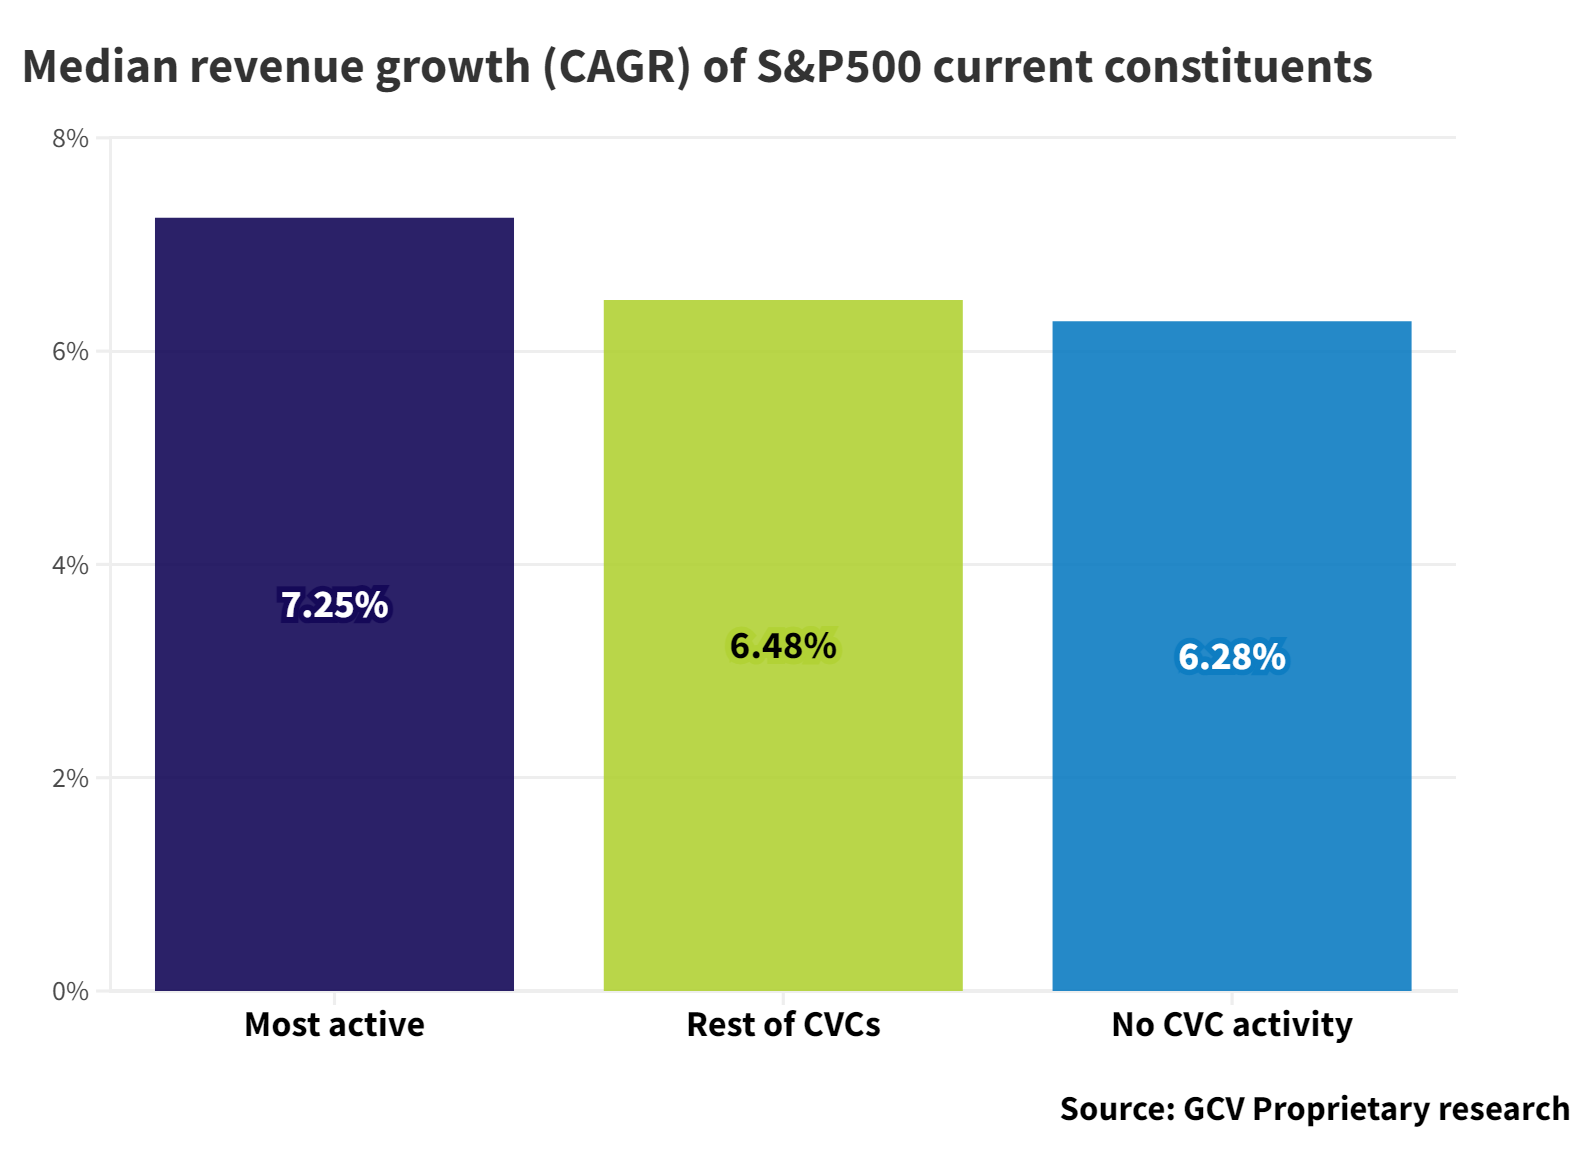
The same is also true for revenue growth. The ‘most active’ cohort saw their sales rise at a CAGR of 7.25% (median) versus 6.48% of the ‘Rest of CVCs’ and 6.28% of those with no CVC activity.
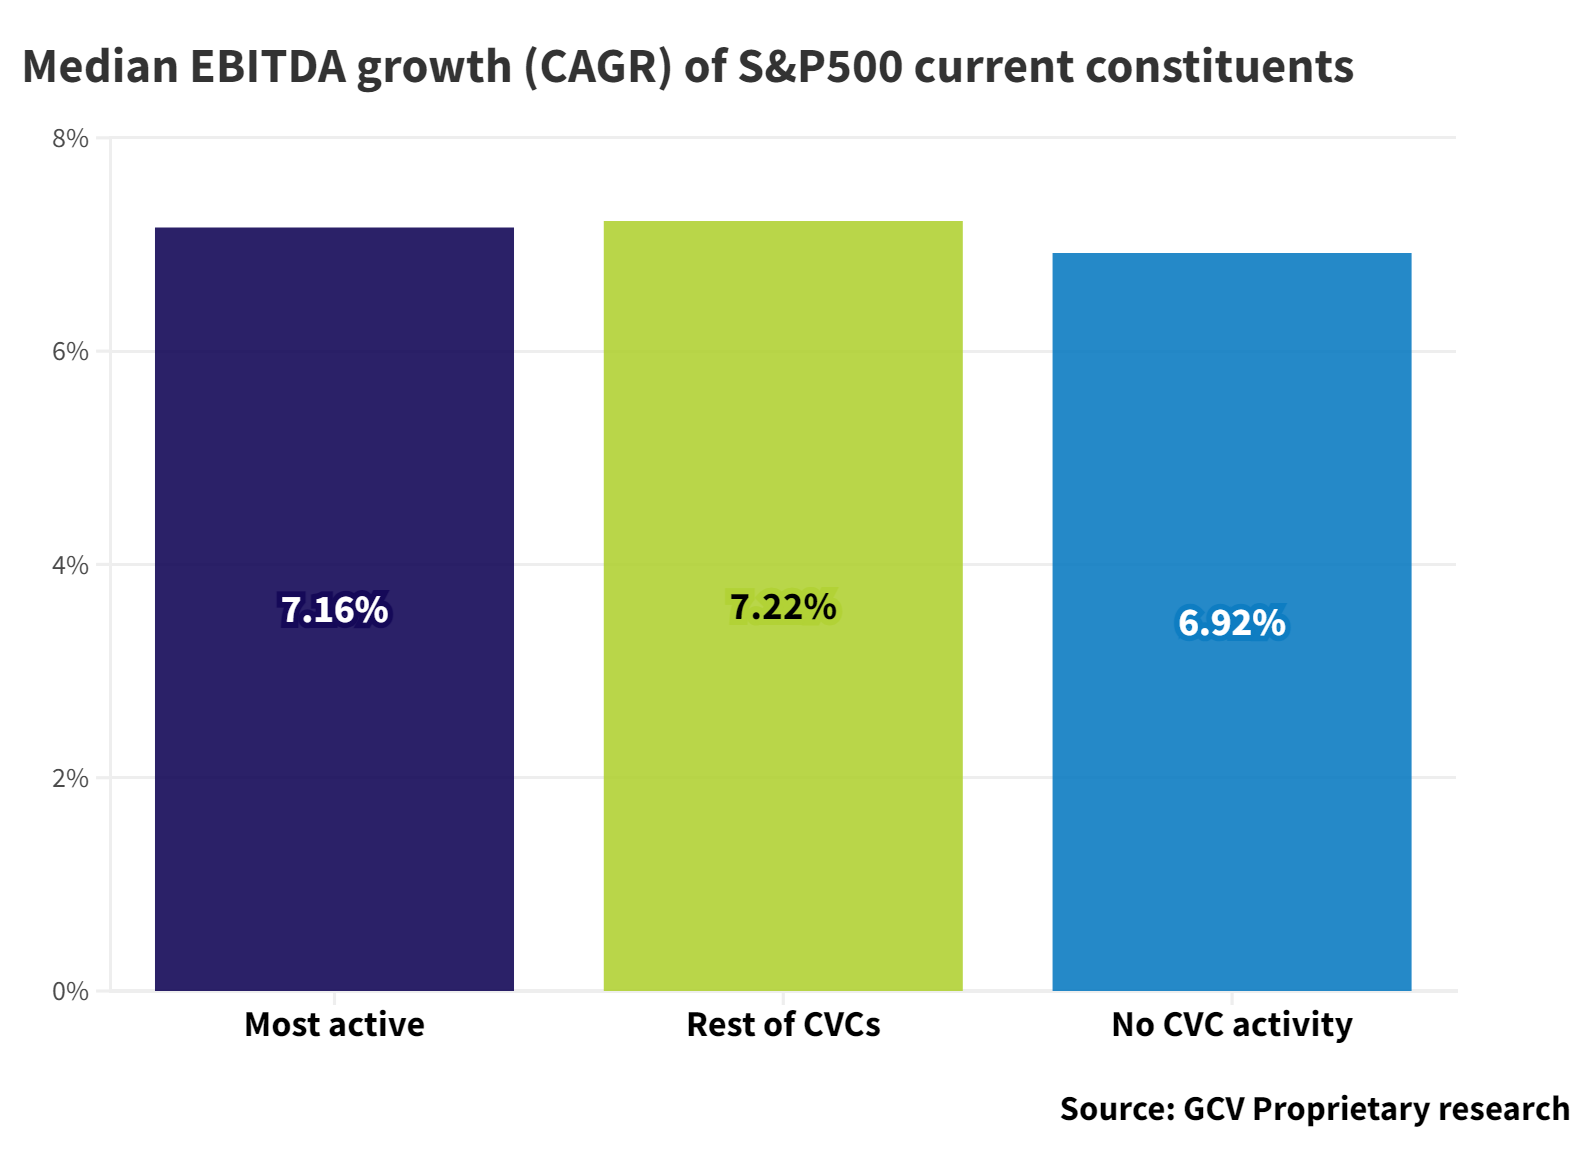
The outperformance in terms of EBITDA growth, though, was slight and rather marginal for both CVC cohorts, as shown on the following chart. Despite its popularity, EBITDA is a pliable non-GAAP measure, which also makes it easily susceptible to influence. So, taking EBITDA with a pinch of salt is advised.
There are, however, other non-GAAP measures which, unlike EBITDA, could be more useful to judge the health of a business and its ability to generate free cash flow.
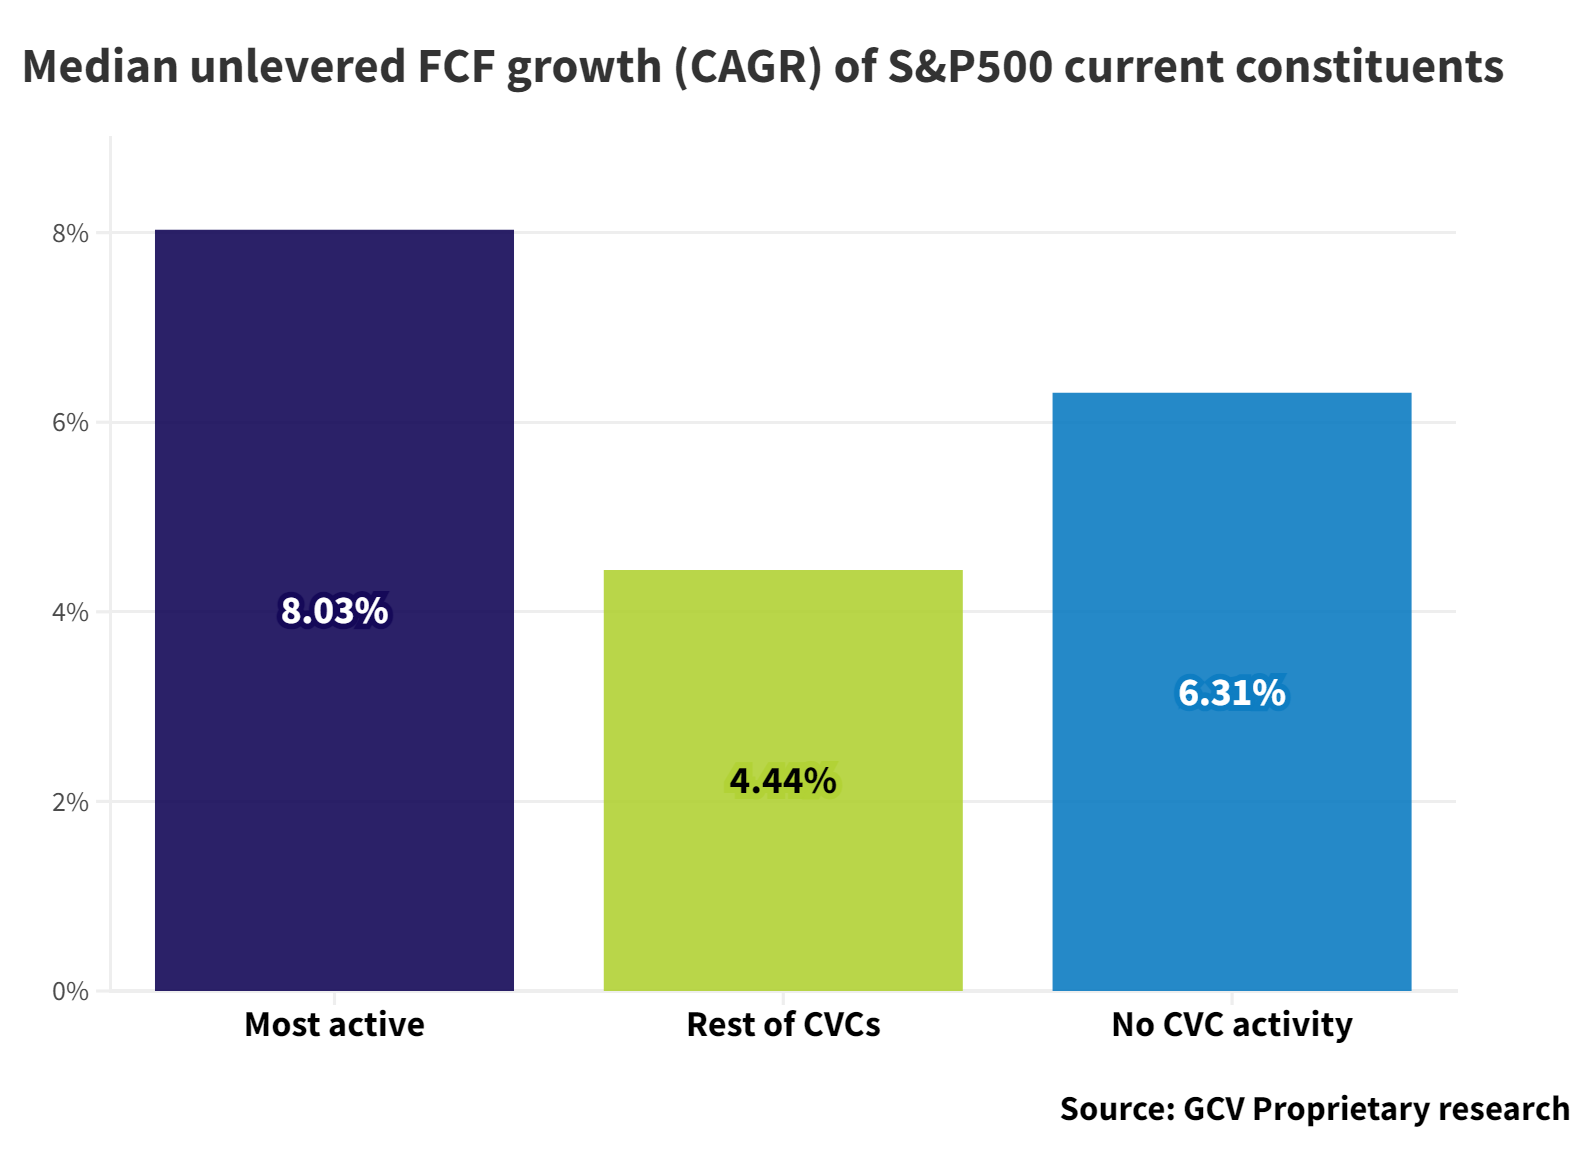
The unlevered free cash flow refers to the amount of free cash available to a company before any financial obligations. The exact formula adds NOPAT (Net Operating Profit After Taxes) to the reported depreciation and amortisation and then subtracts the increase in net working capital as well as the amount of capital expenditures (capex).
The ‘most active’ cohort outperformed by a large margin both the ‘rest of CVCs’ and ‘no CVC’ activity with a CAGR of 8.03%. However, more interestingly, the ‘rest of CVCs’ cohort performed substantially worse (4.44% CAGR) than the group of corporations with no CVC activity (6.31%).
If you look at the levered free cash flow indicator, which accounts for cash flows after interest-related expenses, the difference between the ‘most Active’ cohort and the ‘no CVC Activity’ is drastically reduced, likely reflecting indebtedness of corporate entities. Taking more debt has been arguably rather encouraged by the availability of cheap credit over much of the past decade and the respective tax shield it provides in US context.
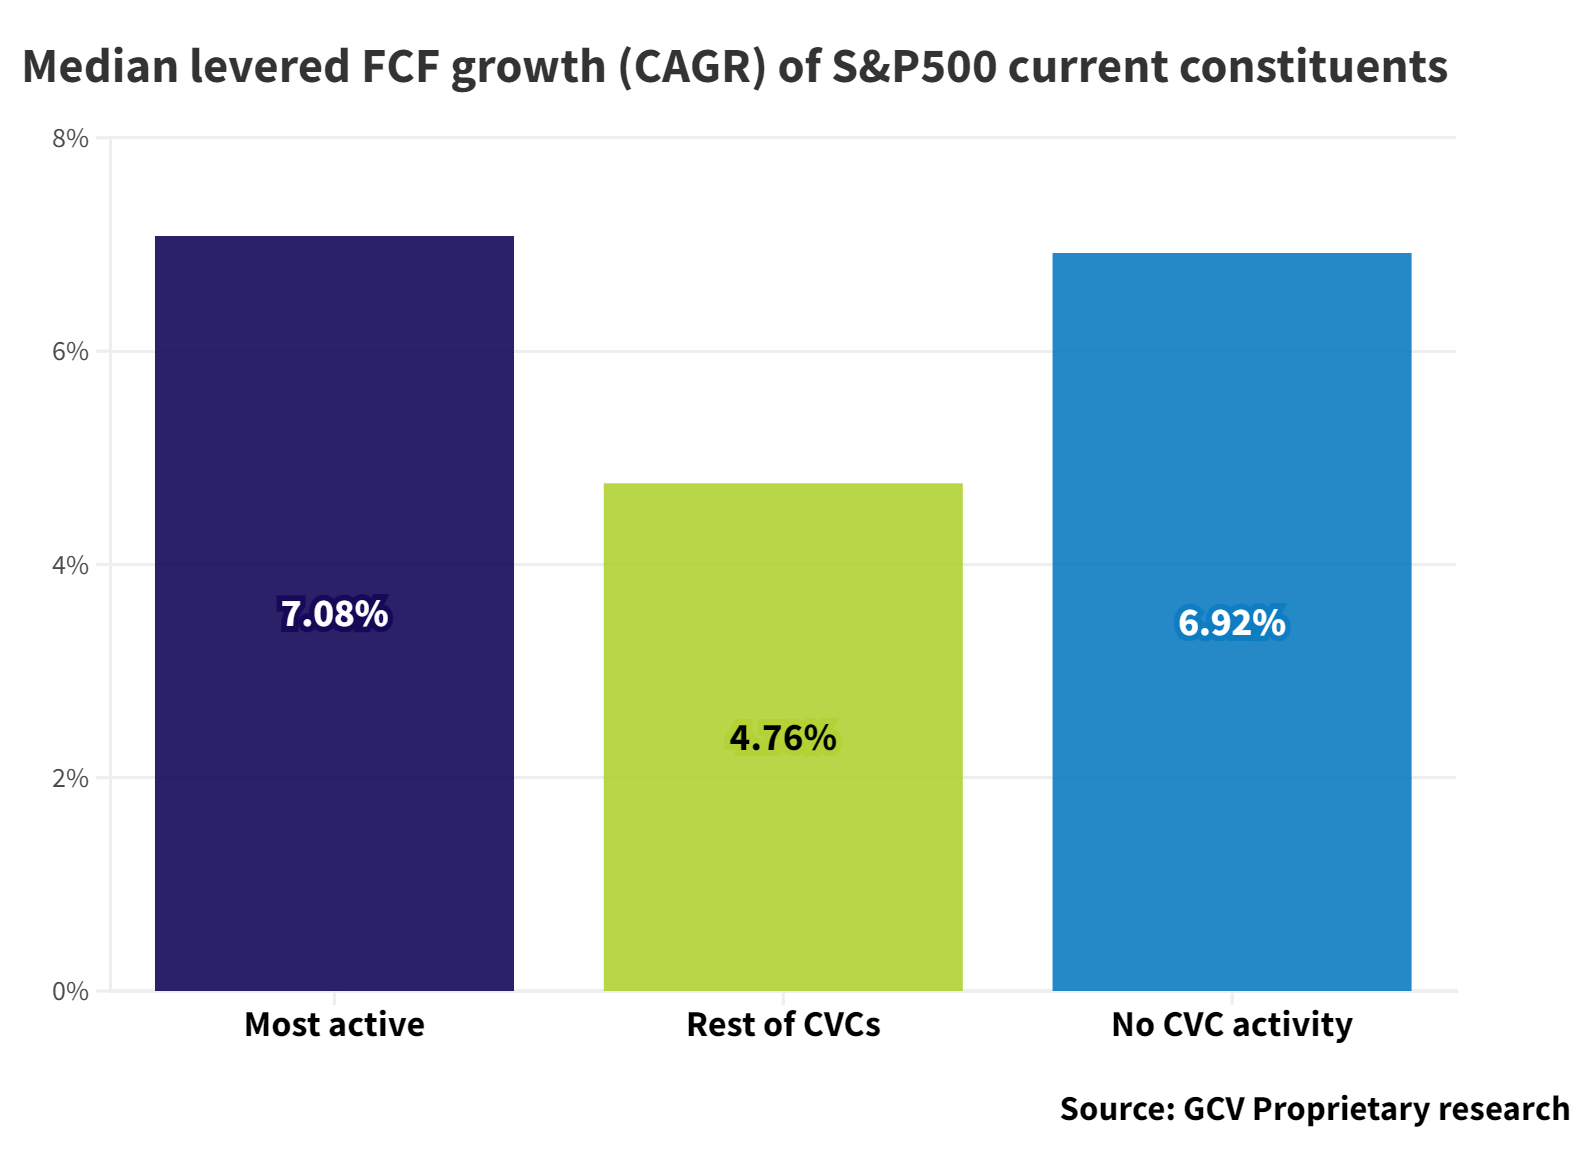
This implies that if you’re considering getting involved in corporate venture capital, you might be better off doing it seriously rather than dabbling as far as free cash flows are concerned.
We cannot establish causality. Doing CVC in a serious, consistent and formalised fashion may not necessarily result in higher free cash flow growth for the mothership. It could also be the case that the businesses that grow their free cash flow fastest may simply be the ones that have the wherewithal and the corporate culture to run a CVC units seriously and consistently.
But the correlation between presence of a CVC unit and business performance is large enough to be worth noting. This is an area in which it would be well worth carrying out further research and we would welcome thoughts from the corporate venturing community on how we might take next steps in this research.
Note on methodology
In our analysis, we used the constituents of the S&P500 as of mid-2023. Stock price return performance figures cited here are based on stock price data going back to 2015, which we extracted from charting software TC2000. We also gather fundamental data and financial statements information for each of the constituent companies from TIKR.com and Seeking Alpha´s database. The financial statements data runs from 2013 to the end of 2022.
