Questions were refined to create an aggregate basis for the GCV Institute’s new CVC operational and performance benchmarking platform, which will enable the filtering of this aggregate data by relevant maturity phase, vertical industry, operating model etc.
The survey asked 45 questions encompassing the following key topics:
- Charter and Funding
- Structure
- Investment Strategy
- Performance
- Team and Compensation
- Automation
In addition to the general survey, GCV provided support for local surveys conducted in Mexico and Brazil in partnership with the Mexican Association of Private Equity and Venture Capital Funds (AMEXCAP) and the Private Equity and the Venture Capital Association in Brazil (ABVCAP). GCV partner and sponsor Proseeder also generously contributed to the survey. Highlights from the Brazil and Mexico surveys are also summarised in the two addenda to this piece.
Respondent pool demographics
The 2022 survey tapped GCV’s access to a significant pool of CVCs spread across the across the globe and representing a good cross-section of industries and maturity phases. Special efforts were made to ensure that input from both CVC industry leaders and emerging programmes were included in data set.
In the three surveys, a total of 213 individual responses were collected. We received 157 individual responses in the general survey. The average number of respondents per question was 135 (with a mode of 140), which implies a high response rate per question of about 86%. The response rate per question varied depending on participants’ willingness to disclose information about their unit and investments.
Corporate venturing role
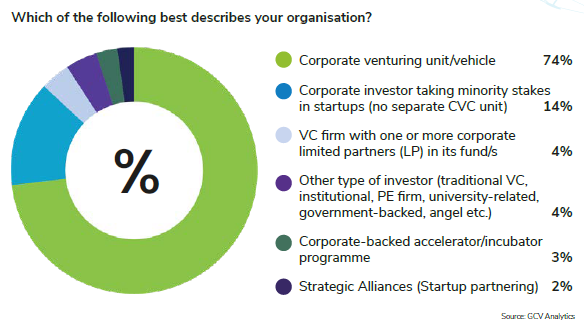
Over 90% of respondents described themselves as corporate venture investors with the vast majority (74%) operating as dedicated direct investing units, 14% investing directly without a formal CVC unit and 4% investing primarily through LP positions.
Corporate parent industry sector
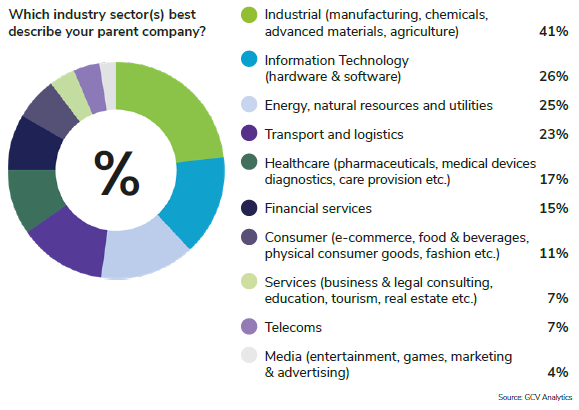
The respondent sample included all ten sectors tracked by Global Corporate Venturing with a number of corporations addressing multiple verticals. It is important to bear in mind that the survey gave respondents the opportunity to describe their corporate parent corporate by selecting more than one sector. As a result, some sectors like industrial and IT have been selected by multiple respondents, along with others.
Parent headquarters and participant geography
Survey respondents were representative of the global nature of corporate venture investing, with roughly equal numbers of responses from US-based and Europe-based corporations (30% and 31% of the total, respectively) as well as significant participation from CVC programmes of APAC-based corporations (27%).
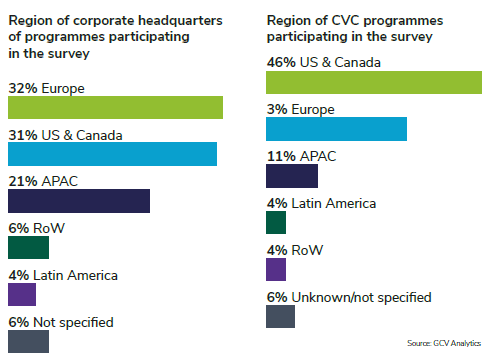
However, many respondent programmes are active in regions outside the parent HQ, with 46% actually based in the United States and 30% in Europe, and only 11% based in APAC.
CVC programme maturity phase
Survey respondents included a balance of startup phase (years 0-3), expansion phase (years 4-6) and resiliency phase (Years 7-9+) participants.
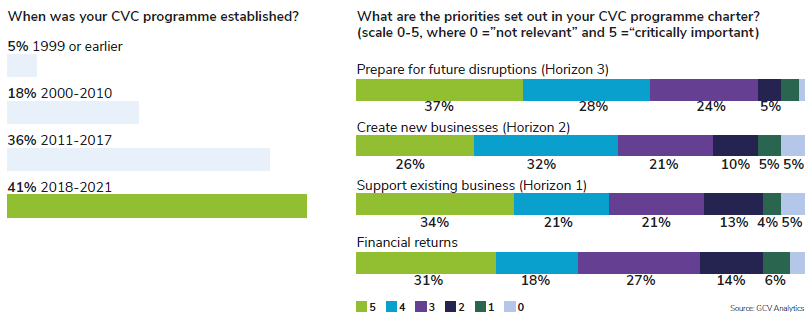
While 41% of participants came from units created since 2018, the majority represented established programmes with 36% coming from expansion stage programmes and almost 25% from resilient programmes with long track records.
Charter and Funding
Charter
Survey results illustrate that most CVCs are chartered to invest beyond the scope of existing parent businesses, with preparing for future disruption (Horizon 3) and creating new businesses (Horizon 2) ranked as the top priorities.
However, the strong weightings for a Horizon 1 mandate suggest that many CVCs are adopting multi-stage investment strategies for portfolio balance and are concerned about lead time to value.
For professional CVCs, delivering competitive financial returns are seen as table stakes for CVC programme survival – half of survey respondents rated financial returns as a top priority and 75% as very important.
Total Assets Under Management (AUM)
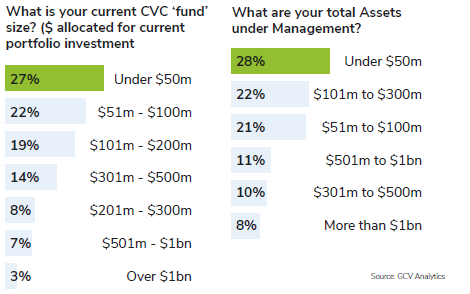
Assets under Management follow the same pattern with even wider divergence between the number of firms and the capital and portfolios they manage. While 71% of respondents reported total AUM of under $300m, they only accounted for an estimated 26% of value. Some 19% of respondents were reporting AUM of more than $500m and accounted for 62% of estimated value.
These results are not surprising considering recent spikes in valuations across most horizontals and verticals. This has been even more the case after the onset of the covid-19 pandemic and the flood of liquidity in both public and private markets.
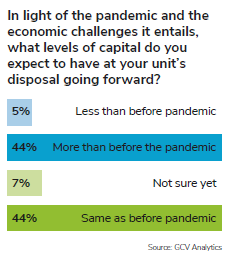
The covid-19 pandemic brought about a global economic downturn. As the world has not shaken off its effects entirely yet, it was only appropriate to enquire once more about the expectations of corporate venturers regarding the availability of funds for their investment vehicles going forward. The responses were overall positive, with 44% of respondents expecting to have the same level of capital at their disposal as before the pandemic and another 44% expecting to have even more funds to invest in emerging businesses. Only 5% of respondents are expecting to see a cut in the funding available and some 7% are still uncertain about the matter.
2022 lookahead
Legal and organisation structure
Operating model
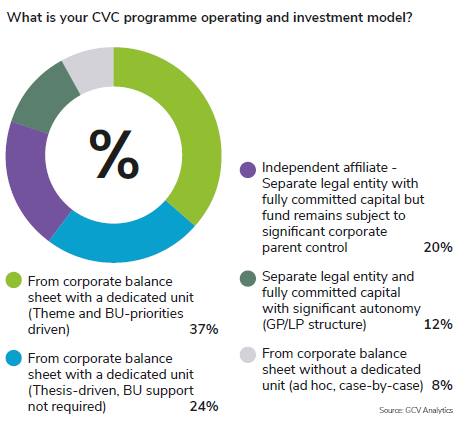
Over the past few years, a number of CVC operating models have emerged, although more than two-thirds reported investing in emerging businesses from the corporate balance sheet – whether through a dedicated unit that is theme-driven and aligned with business unit priorities (37%) or through a thesis-driven programme which does not require tight business unit (BU) alignment (24%). The relatively small number of ad hoc corporate investors (8%) reflects industry recognition of the specialist nature of CVC investing.
A growing number of programmes report investing through separate legal entities with fully committed capital in ‘funds.’ In this year’s survey, 20% describe themselves as an independent affiliate structure which still is subject to significant parent control (e.g. executive investment committee, corporate HR etc.). Separate legal entities with more significant operating autonomy from the mothership account for 12% of responses.
Reporting structure
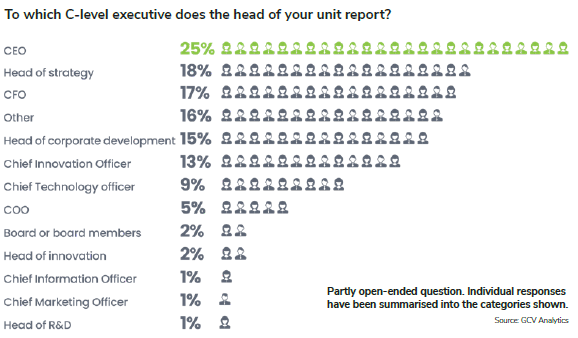
As CVC has become recognised as a mainstream weapon in the corporate innovation arsenal, most programmes now report up through a C-Level executive, who is no more than two levels below the CEO. Heads of venturing units most often report to the chief executive officer (25%), the head of strategy (18%), the chief financial officer (17%), and the head of corporate development (15%).
Limited Partner (LP) positions
For CVCs, the alternative to direct investments in young enterprises is taking LP stakes in established traditional venture capital funds. According to our survey, half of all respondents actively take such stakes (48%).
While some may use LP positions as a ‘toe in the water’ for learning to make investments in startups, many now take LP stakes to:
- invest in geographies they do not know well (e.g. China, India, Israel)
- access specialist expertise (e.g. Data Collective, Rock Health)
- draw insights from very early-stage startups (e.g. seed funds).

Slightly over half of corporates (51%) typically hold no more than five stakes in such funds, while 34% say they have none, 9% hold stakes in six to nine funds and 6% in more than 10. It must be noted that this does not conflict with results from the other question asking corporate respondents if they actively seek to take LP positions in VC funds. It is to be expected that CVCs, which already have some track record, may still hold LP stakes in VC funds they have committed capital to in the past but no longer actively seek to take such positions, opting to invest directly.
Investment Strategy
Focus area definition approaches
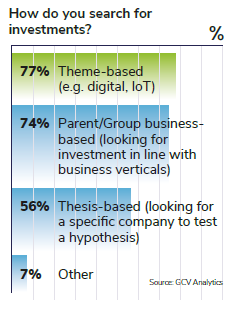
CVC investment sourcing is often driven by a mix of theme-based focus areas (77%), responses to specific corporate parent problem sets (74%), and investments in specific companies to test hypotheses (56%).
Investment stage preferences
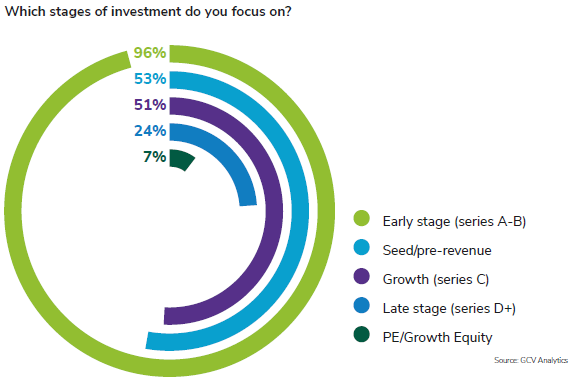
The sweet spot for the overwhelming majority (96%) surveyed is early-stage investments (series A or series B). However, slightly more than half of corporates will also invest in seed stage pre-revenue businesses (53%) or in growth stage companies raising a series C round (51%). Nearly a quarter (24%) also invest in late-stage companies (series D and beyond) but only 7% in private equity and growth equity rounds.
Geographic preferences
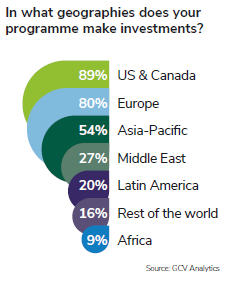
Although two-thirds of respondents invest globally, North America remains the top source of entrepreneurial talent, with 89% of respondents focusing on businesses based in the US and Canada, 80% on European startups, 54% on companies from the Asia Pacific region, 27% in the Middle East, 20% in Latin America, 9% in Africa and 16% throughout the rest of the world.
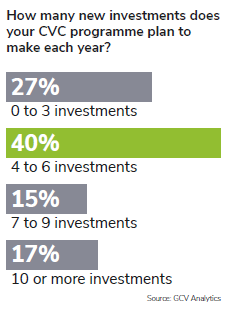
73% of survey respondents are active investors with 40% looking to make up to six new investments per year with, 15% to make 7-9 investments and 15% to investing in more than 10 new startups per year.
Parent or BU sponsorship
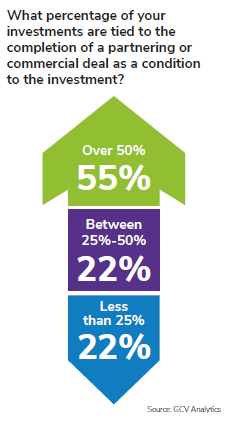
Given the early-stage investment focus of most respondents, 55% of respondents do not generally require BU sponsorship or a commercial deal as a condition for investment, although parent engagement is an important strategic metric for many CVCs. On the other hand, 22% require at least line of sight to a portfolio company-parent commercial relationship.
Survey results highlight that professional CVCs increasingly understand the rules of the venture capital game and are less likely to ask for objectionable control terms.
While more than half of corporates (51%) do not ask for any specific rights related to the sale of a portfolio company, there are investors who may ask for the slightly more controversial right of first refusal (29%), right of first offer (18%) and right of first negotiation (15%). Other rights of interest to corporates included right of first notice and similar information rights.
CVC alignment with mergers and acquisitions (M&A)
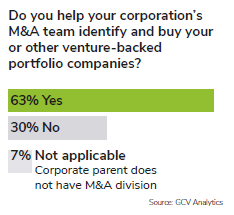
Nearly two thirds of the surveyed corporate venturing units (63%) collaborate closely with the corporate M&A division in identifying and buying companies. However, it is important to stress that these results do not suggest that venturing arms necessarily act as extensions of corporate M&A divisions.
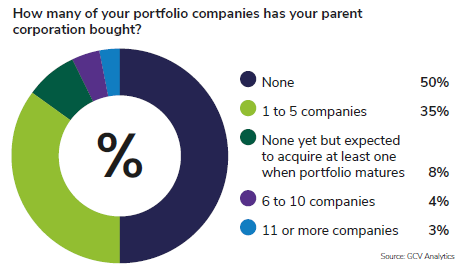
While close to two-thirds of responding units help source deals for corporate development or M&A, 50% have yet to have a portfolio company acquired by the parent and 35% have less than five parent exits.
Syndicate roles
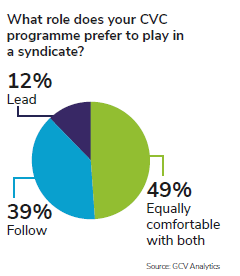
With the professionalisation of the industry, more CVCs are prepared and willing to lead rounds. Nearly half of respondents say they are equally comfortable leading or following in a deal. Only 12% have a clear preference to lead, while 39% prefer to follow.

Board and observer seats
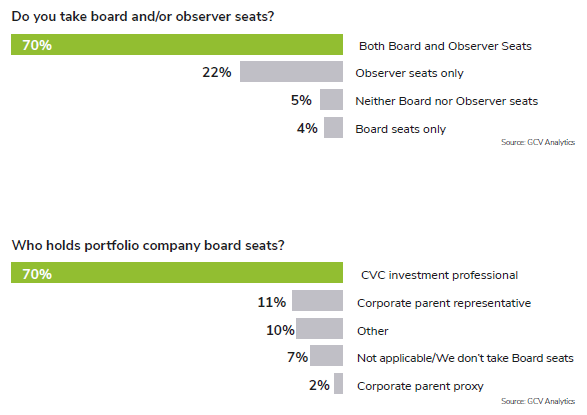
To both provide and derive value from strategic investments, the majority of surveyed CVCs (70%) look for both board and observer seats. While taking an observer seat constitutes a less sensitive and unimposing approach to emerging businesses, having a board seat allows for more control over the strategic direction of the portfolio company, which may be very important to corporates, given their strategic orientation. In most cases (70%), the person taking the board seat is a professional from the CVC team and in 11% of cases it is a representative from the corporate parent.
Performance
Financial metrics
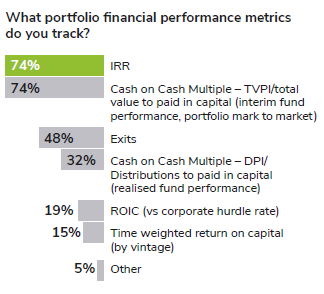
Survey results show that the majority of CVCs rely on standard VC financial metrics such as internal rate of return or IRR (74%) and total value to paid in capital or TVPI (74%), also known as the cash-on-cash multiple. Other important metrics to CVCs are exits (48%), distributions to paid in capital (32%) and return on invested capital (ROIC) against a corporate hurdle rate (19%).
More than half of surveyed CVCs are targeting VC-level financial returns – 36% aim for VC financial returns of 1.6x to 2.5x (with an implied IRR of 16% to 24%), while 20% aim to reach the top quartile of venture capital returns of more than 2.5x their capital invested. Another third is expected to at least cover investment costs.

How do financial performance goals line up with reality? Overall, the CVC respondent pool has performed well, benefitting from soaring valuations and a hot IPO market.
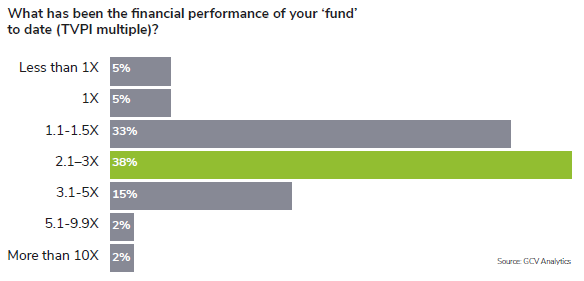
A third of the total (33%) have generated a portfolio TVPI multiple of 1.1x to 1.5x, while nearly four out of every 10 (38%) have multiplied their capital between 2.1x and 3.0x. Some 15% of respondents claim to have multiplied it between three to five times.
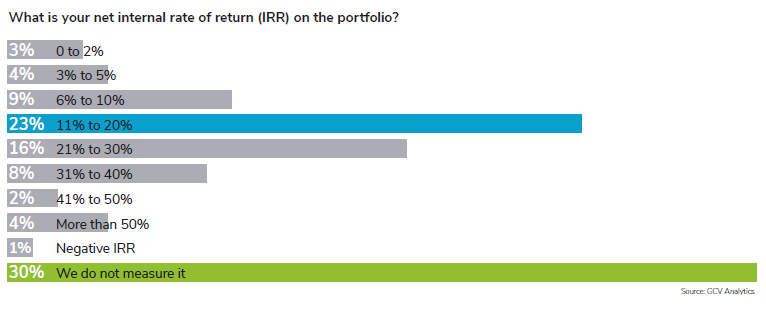
Although one third do not track IRR as a performance metric, 23% of the CVC respondent pool have generated portfolio IRRs between 11% and 20% and 16% between 20-30%. 14% claim to have an IRR of 31% or higher. Less than 20% report IRRs of less than 10%, with 1% in the red.
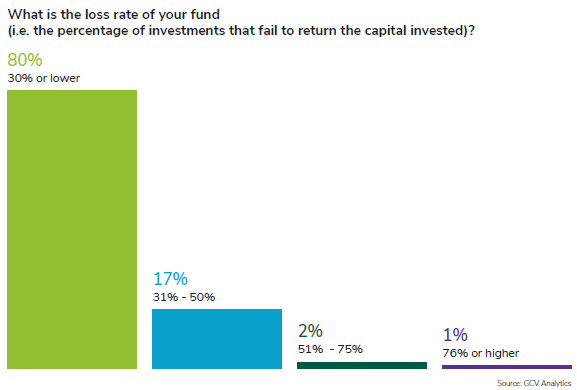
Venture investing inevitably features bad bets and losses due to the high degree of uncertainty involved in what is widely considered to be the “riskiest asset class”. Naturally, in such a business, the lower the number of bad bets, the better the overall performance of the fund. Most CVCs (80%) say the loss rate of their fund – defined as the percentage of investments that fail to return the capital invested – is 30% or lower. This is an impressive figure, even if potentially suffering from a certain self-reporting bias. It could be attributed to the higher degree of technical and industry expertise that corporate venture firms boast.
Strategic metrics
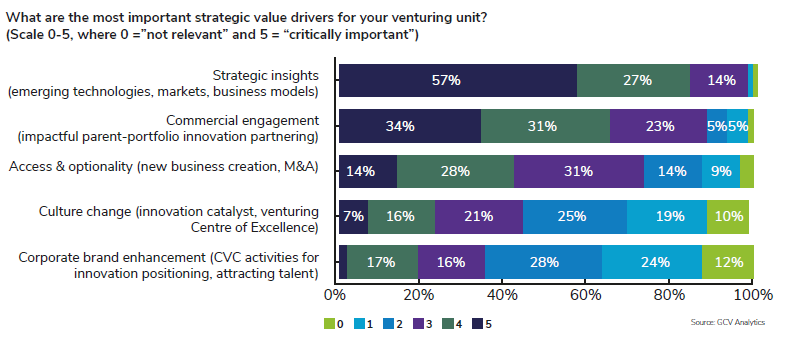
When rating the importance of value drivers for their venturing unit, respondents give the highest scores on the scale (4 and 5) to strategic insights on emerging tech (84%), commercial engagement (65%) and access and optionality (42%). Less highly rated are culture change (23%) and corporate brand enhancement (19%). These results are consistent with findings from previous years.
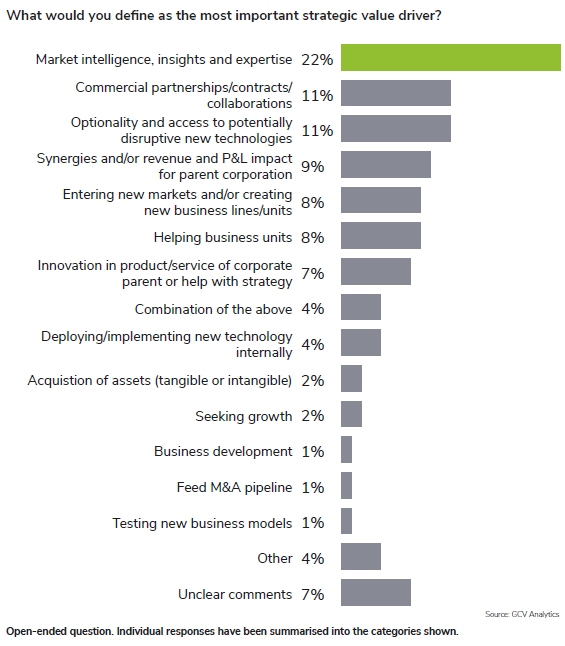
When asked to define “the most important strategic value driver” in an open-ended question, top of the list was gathering market intelligence and insights (22%), followed by establishing commercial relationship (11%) and having optionality and access to external innovation (11%). Also important are achieving synergies and P&L impact for the corporate mothership (9%), entering new markets and creating new business lines (8%) as well as helping business units (7%).
Portfolio development
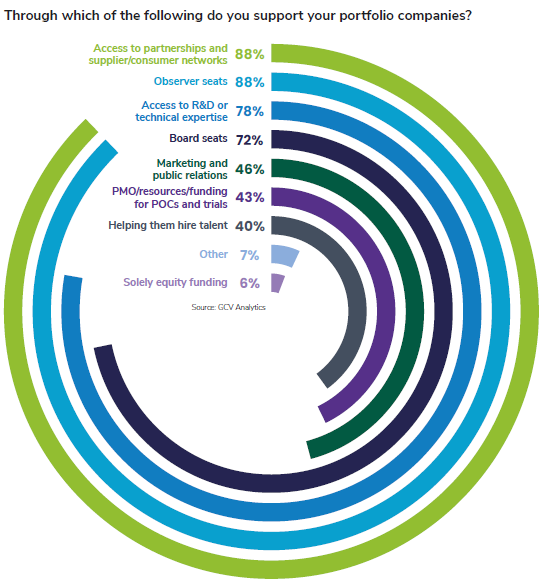
Unlike traditional venture capitalists, CVCs bring knowledge and expertise that allows them to better understand and help companies in their portfolios in a variety of ways. Respondents see their most valuable portfolio company contributions to be:
- access to partnerships and supplier networks (88%)
- advisory support through observer seats (88%)
- access to research and development (R&D) and technical expertise (78%)
- venture development support through board seats (72%)
Portfolio company diversity
With the rise of impact investing and ESG approaches for publicly listed companies in recent times, more corporate venturing units are prioritising diversity as an important investment criterion. However, slightly over half of respondents (51%) say a quarter or fewer of the founders of their portfolio constituents come from an ethnically diverse background and 30% say it is between a quarter and half of the entrepreneurs they have backed. These figures suggest there is still room for improvement in this regard.
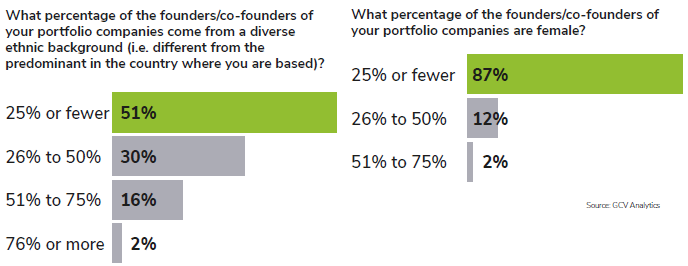
In a similar vein, corporate investors are keen to back companies founded by female entrepreneurs who raise a disproportionally small percentage of the total dollars in the world of venture capital. The vast majority of CVC respondents to the survey (87%) say only a quarter or fewer of their portfolio companies have female founders. Therefore, there is much room for improvement in giving opportunities to female entrepreneurs as well.
Team
Total CVC team size
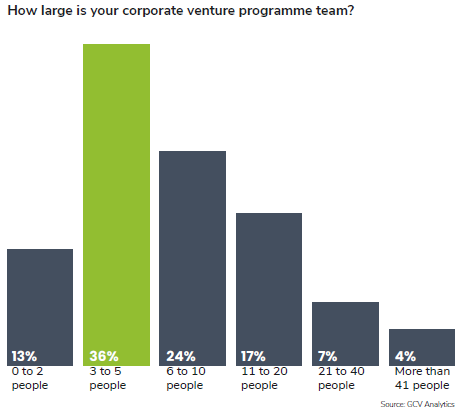
The venture capital business revolves around people and the number of people in each corporate venturing team varies. However, the majority of CVC programmes (73%) have a team size of less than 10 professionals, with 36% counting three to five people and 24% between six and ten people. Around 13% have only up to two team members. Some 17% have a team of 11 to 20 people and 11% of 21 or more people.
CVC team roles
A distinguishing characteristic of today’s corporate venturing programmes is the adoption of an end-to-end investing approach which is fundamental to both portfolio financial performance and to the delivery of the end-game strategic impact needed to persuade parents of the continuous value of those CV programmes.
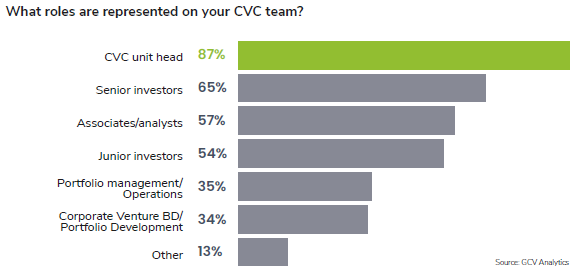
As the CVC industry has professionalised over the past 10 years, standard roles have emerged that combine a professional VC-like investing function with a professional corporate venture business development or portfolio development function designed to land the value of an investment for both parent and portfolio company. Also important is the emergence of the COO or strategic portfolio role which knits all the pieces together.
Younger CVC programmes are most likely to start with the CVC unit head and senior investment professionals, and then to add junior investment team members, corporate venture business development or portfolio development and operations resources, as the programme expands.
CVC team age and experience
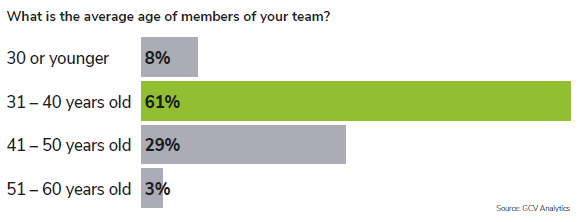
In six out of every 10 corporate venture capital firms (61%), teams have an average age between 30 and 40 years old and in 29% of them between 40 and 50. Only 8% of firms say the average age of their team members is under 30 and just 3% between 50 and 60 years old. Corporate venturing appears, therefore, to be a place for professionals with certain level of experience.
CVC team diversity
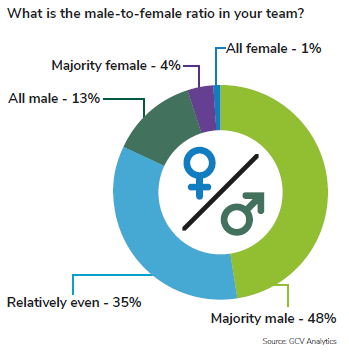
Slightly less than half of corporate venture units (48%) are still populated either exclusively or mainly by men – versus 53% from the previous reading of this indicator, which suggests a steady improvement. Moreover, 35% claim to have hired a relatively even gender split (versus 31% according to last year’s survey), also indicating an improvement.
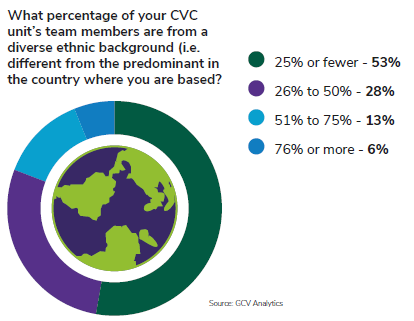
While the corporate venture capital industry has made progress on the gender balance in its professional teams, ethnic diversity is yet to be addressed. 53% of corporates stated that a quarter or fewer of their team members come from an ethnic background that is different from the predominant in the country where they are based. In only 19% of cases, people from diverse ethnic backgrounds constitute more than half of the venturing team. These figures are similar to results from last year.
Compensation approach
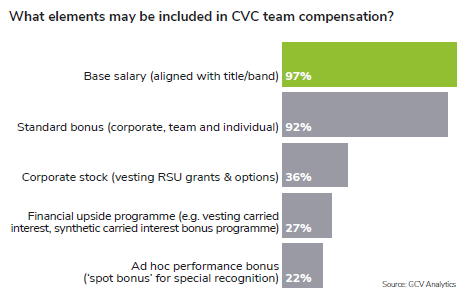
Recruiting and retaining a high-quality team is foundational to CV programme performance and longevity and sustainability. Corporates are most likely to employ standard HR levers, when constructing CVC team packages. Aside from title or band-aligned base compensation (97%), the most common incentives include standard corporate bonus (92%), corporate stock (36%) and ad hoc performance bonuses (22%).
However, nearly 30% of CVCs are now adopting financial upside compensation schemes such as synthetic carried interest.
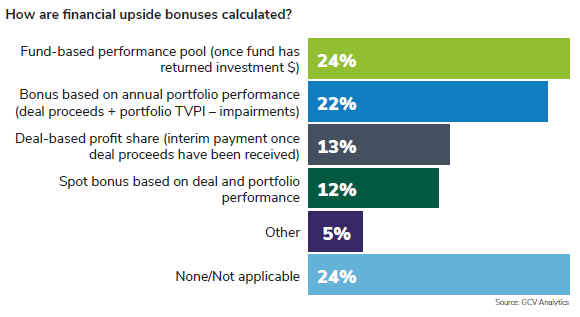
The process for calculating financial performance (carried interest or “carry”) pools and the timing for payment varies widely. 24% of respondents take a fund-based approach which calculates profits only once all fund investment capital has been returned. 22% define a yearly bonus pool based on a combination of annual deal proceeds and portfolio value minus impairments. 13% offer some form of deal-based profit share that enables payments ahead of full fund returns. 12% have a “spot bonus” system for rewarding exits.
CVC leader compensation
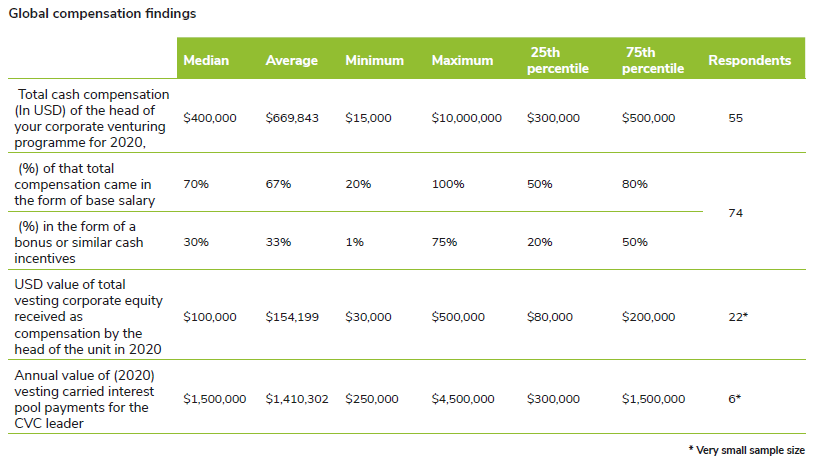
Based on compensation related questions in our survey, we determined the median value of total cash compensation of heads of corporate venturing units amounted to around $400,000 in 2020, while the average one to $669,843 – ranging from a recorded disclosed minimum of $15,000 to a maximum of $10m. The percentage of total compensation in the form of base salary registered a median value of 70% and an average value of 67%, ranging from a minimum of 20% to a maximum of 100%. Similarly, cash bonuses make up 30% (median) to 33% (average) of total compensation.
The sample size of respondents was small for our questions on the value of total vesting corporate equity received by the unit head in 2020 and the annual value of vesting carried interest. However, we can say that the median value of vesting equity stood at around $100,000 and of vesting carried interest at around $1,500,000. It is to be borne in mind that the figures presented herein include input of respondents from around the globe in whose jurisdictions compensation levels and fiscal situations may vary significantly from conditions in the United States where a good majority of corporate venturing units are based.
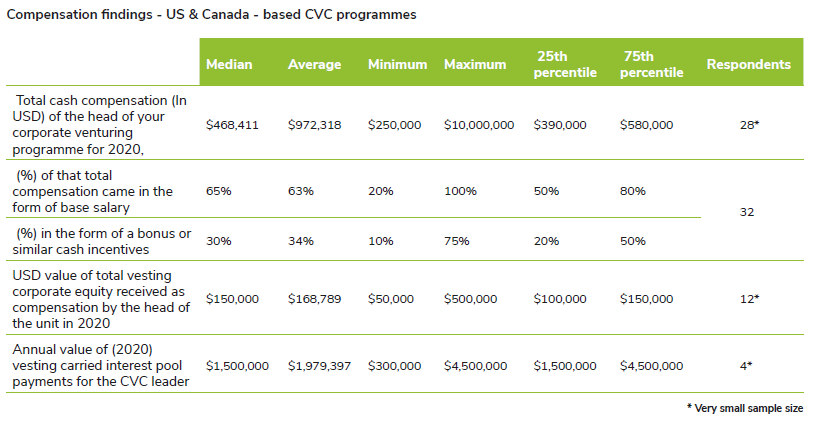
Therefore, it is also instructive to look at the same indicators just for CVC programmes based and operating out of the United States and Canada. On the second table, sample size issues notwithstanding, it can be easily discerned that median dollar figures for North America stand significantly above the global figures estimated – with total cash compensation of the head of unit at $468,411, dollar value of vesting equity at $150,000 and dollar value of vesting carried interest at $1,500,000. The median percentage figures of base salary (65%) and bonuses (30%) are close to the overall global figures.
Deal flow management automation
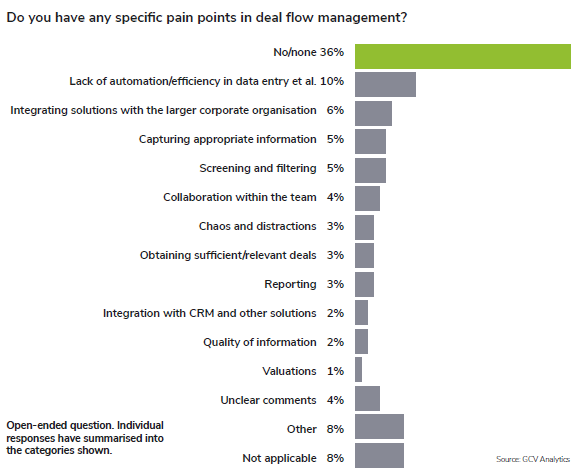
When asked to identify deal flow and deal management pain points, respondents highlighted were lack of automation and efficiency related to data entry (10%), troubles integrating software solutions they use with other solutions of the larger corporate organisation (6%), capturing appropriate information (6%) and issues with screening and filtering information (5%). However, 36% say they do not have significant issues to report.
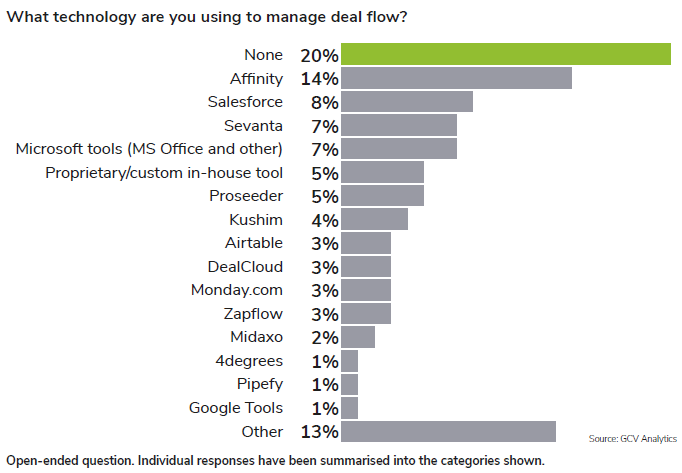
When asked about software tools used to manage deal flow, a fifth of the surveyed (20%) have not yet implemented a solution. The most often used ones, however, include Affinity (14%), Salesforce (8%), Sevanta (7%), various Microsoft tools (7%), Proseeder (5%) and proprietary tools developed inhouse (5%).
Surveying the corporate venturing space in Brazil
Global Corporate Venturing also supported a survey conducted by the Brazilian Association of Private Equity and Venture Capital (Associação Brasileira de Private Equity e Venture Capital– ABVCAP), which decided to study its local corporate venturing space. The association gathered a total of 33 responses. Even though the sample size itself is just enough to surpass the level of statistical significance, the findings are likely representative for the venturing scene in Brazil and its emerging corporate venture capital community. With the following charts, generously provided by the ABVCAP, we summarise some findings, comparing Brazil’s corporate venture ecosystem with figures from our global survey.
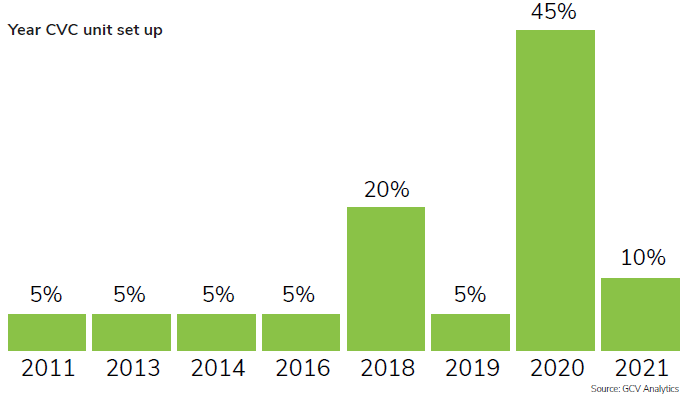
In Brazil, more than half of the surveyed corporate venture programmes (55%) were set up over the past two years and only 15% were set up before 2015. This figure is higher than the figures from the global survey where only 41% of respondents came from CVC units set up after 2018. This reflects the fact that Brazil’s corporate venturing ecosystem is still younger than average. This is also evident from other findings, such as the fact that 80% of the surveyed reported never to have scored an exit or that 75% of them actively seek to co-invest with other corporate and traditional VC firms.
In Brazil, 60% of CVC programmes have made fewer than five investments since inception and 15% claim to have not made any yet. There are another 15% of respondents who have made more than five. This is obviously significantly different from many of their global peers, the majority of whom (67%) plan to make anywhere from one to six investments per year.
Despite their relatively young age, Brazilian corporates are broadly similar to their peers elsewhere in their expressed preference for early-stage (series A and B) deals. According to GCV’s global survey, the overwhelming majority of corporates around the globe look for opportunities at exactly that stage.
Brazilian CVCs are also similar to their peers around the globe, when it comes to looking at the most important financial metrics – internal rate of return (IRR) and the cash-on-cash multiple, according to 80% of Brazilian CVC units surveyed. The expected IRR for 20% of them stands at between 21% and 30%. As for the cash-on-cash multiple, the expected value of the portfolios of 40% of the surveyed varies from 1.5x to 3x times the original amount invested. These numbers are broadly similar to findings from our general global survey.
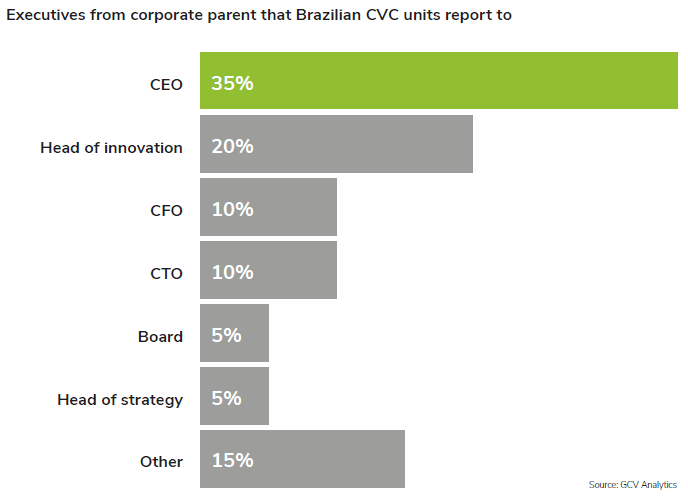
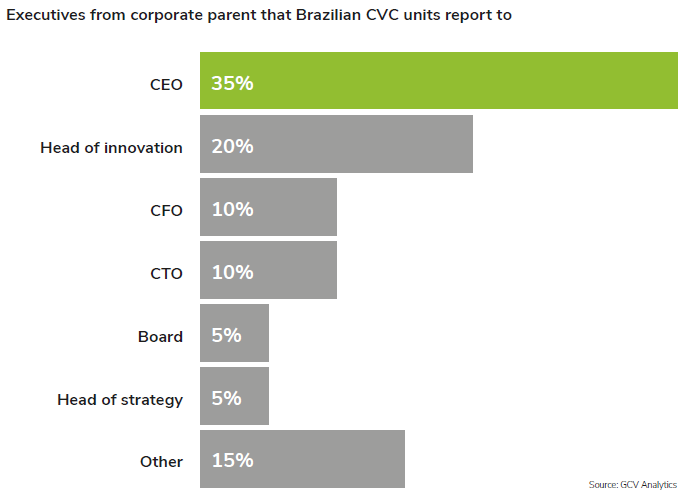
Most CVC initiatives in Brazil (35%) report directly to the company’s CEO or the head of innovation (20%). These readings stand even above their peers elsewhere (25% to the CEO and 15% to the Chief Innovation Officer or the head of innovation).
Corporate venture teams in Brazil are likely somewhat smaller than but still relatively comparable to those of their global peers. According to the ABVCAP survey, the smallest team responding consisted of just one person, while the largest of 11 people, yielding an average of 4.4. people per team. Globally, the majority of CVC programmes (73%) have a team size of up to 10 professionals, with 36% counting three to five people and 24% between six and ten people. As the Brazilian ecosystem is still young, we are yet to see corporates with larger teams of 10, 20 or more people.
However, there is one metric when it comes to teams where Brazil compares relatively favourably with other places around the globe – the presence of female professionals. According to the survey, 60% of corporates had at least one woman in the team. Women were estimated to represent nearly a third (32%) of all professionals working in corporate venture capital there. While there is still much room for improvement, it is undoubtedly commendable to see such numbers of female professionals in an emerging venturing ecosystem.

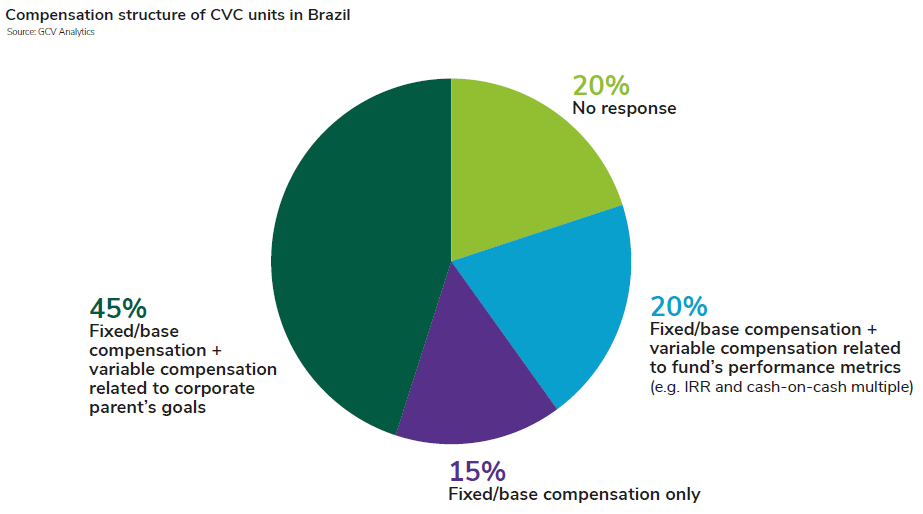
According to the ABVCAP survey, 45% of Brazil´s venturing units reported having a compensation package of base salary and variable compensation related to goals of the corporate parent. A fifth of units (20%) had a mix of base salary and variable compensation related to the fund’s performance metrics (e.g. IRR and the cash-on-cash multiple), while 15% had only compensation in the form of a fixed salary. This compares somewhat unfavourably with typical elements of CVC team compensation globally which include base salary, standard corporate bonus (in 92% of cases), compensation in corporate stock and options (36%) and a financial upside or carried interest programme (27%). This is likely because the corporate venture investors in Brazil have not yet had to face the challenge of retaining talent like their peers in more mature economies and ecosystems.
The corporate venturing arena in Mexico
Global Corporate Venturing also provided support for the survey conducted by the Mexican Association of PE & VC (Asociación Mexicana de Capital Privado – AMEXCAP), which set out to survey the emerging corporate venturing landscape in its home country. The association gathered 23 responses, considering 19 of those responses received as valid or received from people with actual experience in venture capital deals. Even though the sample size itself may seem rather small, it is likely to be representative enough for a budding and emerging ecosystem such as the Mexican one. With the following charts we have summarised some of the most interesting findings to see how Mexico and its corporate venture ecosystem compares with figures from our global survey in certain aspects.
Like most of their peers internationally, Mexico-based corporate venture investors tend to invest from the corporate balance sheet – whether with a specific amount earmarked for the investment activity (53%) or without it (26%).
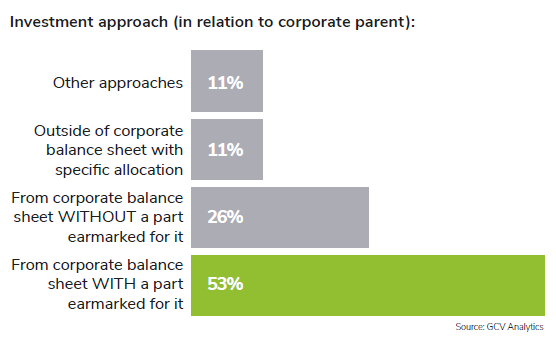
There are some differences in terms of the legal structure of CVC programmes in Mexico versus their global peers. Some 37% of Mexican corporate venture investors are part of their parent corporation, while 58% are set up as separate legal entities – whether with significant control from the corporate mothership (42%) and or with more autonomy (16%). Only 5% report to use an alternative mixed structure.
In comparison, most corporate venturers around the globe invest from the corporate balance sheet – whether through a dedicated unit that is theme-driven and aligned with priorities of business units (37%) or a theme-driven programme without a dedicated unit (24%). There are also some 8% who invest from the corporate balance on ad-hoc and case-by-case basis. Only a fifth of respondents (20%) globally say they invest from outside the corporate parent’s balance sheet as a separate legal entity.
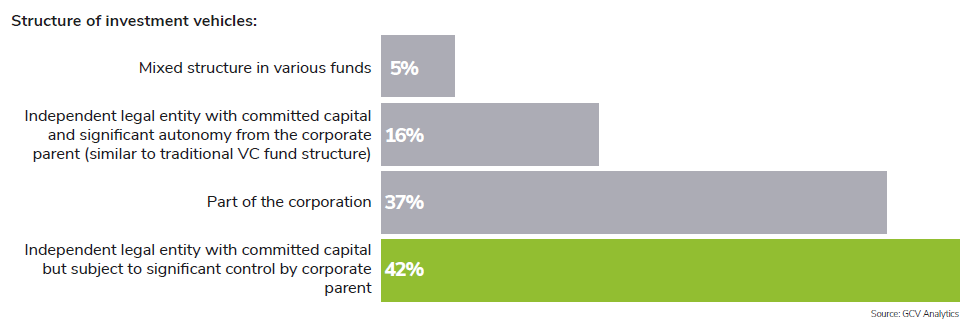
Much like their peers elsewhere in the world, Mexican corporate venturing arms tend to report most often to the most important member of the c-suite – the CEO.
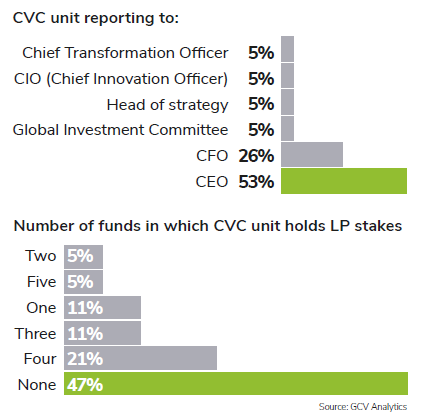
Somewhat unlike the rest of their peers, fewer Mexican corporates appear to hold LP stakes in traditional financially driven VC firms, with 47% of respondents reporting to hold none. This likely reflects the fact that Mexico’s and the Latin American innovation and venture capital ecosystems are still very young and so are the venture investors active in them.
Another significant difference reflecting the young nature of the local ecosystem in Mexico is the average dollar size of the CVC unit’s capital. Only 13% of the surveyed Mexican corporates report to have more than $100m to deploy (versus 51% globally) and 19% report to have between $51m and $100m to deploy, which is actually comparable to the global average for that range of funds (22%).
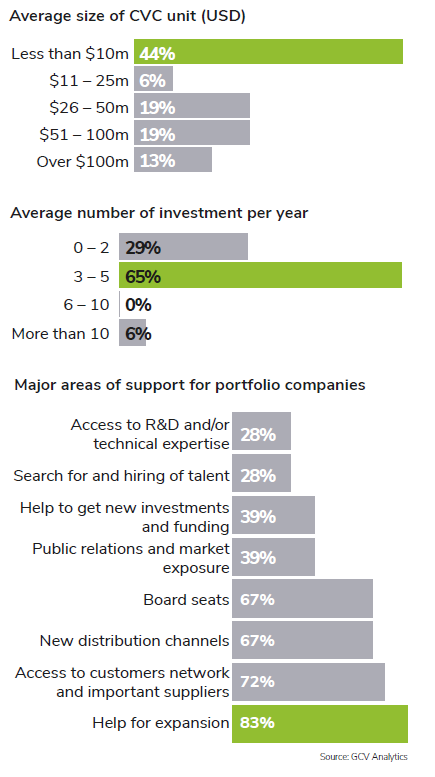
As Mexico-based corporates operate in an emerging innovation ecosystem, they almost expectedly do fewer deals than the global average. The majority (65%) reported doing three to five deals (versus 40% globally doing as many) and 29% say up to two deals per year (versus 27% globally).
There is also some notable difference in how corporates in Mexico see themselves as being able to help portfolio companies in different areas. Most of their peers internationally tend to emphasise on adding value by giving startups access to R&D and technical expertise (78%) and taking board seats (72%). Mexico’s corporate venture investors in turn tend to concur that they are able to help fledgling startups to expand (83%), giving startups access to customer networks and suppliers (72%) and also by opening new distribution channels for them (67%), in addition to taking board seats (67%).
And last but not least, there is one more similarity to international peers, in which there is room for improvement everywhere around the globe and that is the number of female professionals in CVC teams. In Mexico, the median figure appears to be 17% of the team, while the average 10%, which is still a far cry from gender parity.
